Ever wondered why some databases run smoothly while others slow down unexpectedly? Database performance monitoring uncovers hidden issues, tracks slow queries, and prevents crashes before they happen. It helps maintain fast query execution, optimal resource usage, and high system efficiency. Without it, performance bottlenecks can cripple your entire application.
Hold on, hold on.
We’ll now explore key database performance metrics, monitoring tools, and best practices to keep your system running smoothly. Plus, discover advanced techniques to optimize queries, prevent bottlenecks, and boost efficiency effortlessly.
Related: Security Database: Secure, encrypt, and protect your data
What is database performance monitoring?
Database Performance Monitoring is the process of tracking and analyzing a database’s speed, efficiency, and resource usage. It helps identify slow queries, high CPU consumption, and memory bottlenecks that affect performance. By continuously monitoring, businesses can prevent downtime and ensure smooth operations.
Monitoring tools collect real-time data on query execution time, disk I/O, and connection usage. They alert administrators about issues before they cause failures. With proper insights, teams can optimize databases for better speed and stability.
A well-monitored database improves scalability, security, and overall system performance. It reduces unexpected crashes and enhances user experience. Without monitoring, even minor issues can turn into major disruptions.
Types of Database Monitoring
Effective database monitoring is essential for maintaining high performance, security, and system stability.
Different types of monitoring focus on key areas like performance tracking, security analysis, availability checks, and log monitoring.
Together, they provide a comprehensive database management approach.
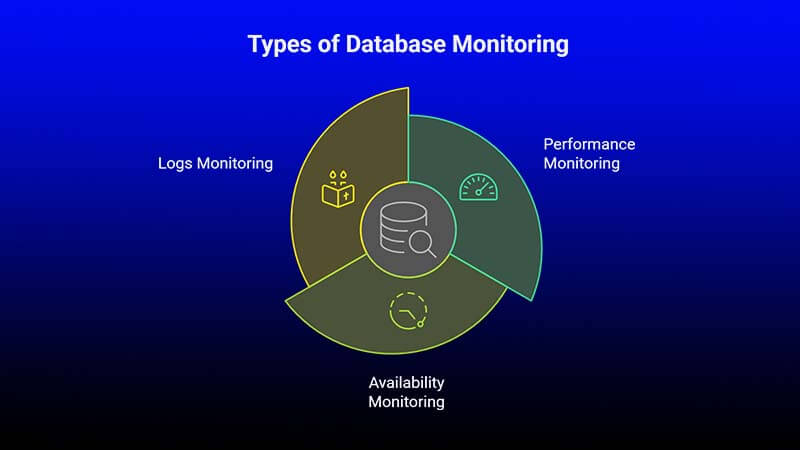
We will see here 3 types of database monitoring. Let’s learn them.
1. Performance Monitoring
Database performance monitoring ensures the system runs smoothly by tracking key metrics. It analyzes query execution time, resource utilization, and response speed to detect inefficiencies. Optimizing these factors helps improve database efficiency and user experience.
2. Availability Monitoring
A database must be available at all times to avoid disruptions. Database availability monitoring checks uptime, detects potential failures, and ensures continuous access for users. Identifying and fixing availability issues prevents unexpected downtime.
3. Logs Monitoring
Database log monitoring involves analyzing logs to track activities, errors, and security threats. By reviewing system-generated logs, user interactions, and unusual patterns, administrators can troubleshoot issues and optimize database performance.
Using a combination of these database monitoring techniques helps businesses maintain reliable, secure, and high-performing databases.
How do you measure database performance?
Measuring database performance starts with tracking how fast and efficiently it handles data. Key factors include query response time, CPU and memory usage, and disk I/O speed. If queries take too long or resources are maxed out, performance issues are likely.
To get a clearer picture, monitoring transactions per second, active connections, and database uptime is essential. Logs and analytics tools help spot slowdowns before they become serious problems. Regular performance checks keep everything running smoothly.
The easiest way to stay on top of this is by using database monitoring tools like SQL Profiler, Prometheus, or New Relic. These tools provide real-time alerts, detailed reports, and optimization insights. With the right approach, you can fine-tune queries, balance loads, and boost efficiency effortlessly.
What is a database monitoring system?

A database monitoring system is a tool that tracks and analyzes database performance in real time. It helps detect slow queries, high CPU usage, and memory bottlenecks before they cause major issues. With continuous monitoring, businesses can keep their databases fast, stable, and reliable.
These systems collect data on query execution time, disk I/O, and active connections. They provide alerts and reports, helping teams fix problems quickly. Without monitoring, databases can slow down, leading to poor user experience and downtime.
Popular tools like SQL Profiler, Prometheus, and New Relic make database monitoring easier. They offer insights into performance trends, security risks, and resource allocation. With the right system, businesses can optimize database health and prevent unexpected failures.
How Do You Monitor Databases?
Effective database monitoring requires tracking key performance areas to ensure smooth operations and system stability. Monitoring these areas helps identify bottlenecks, optimize queries, and prevent downtime.
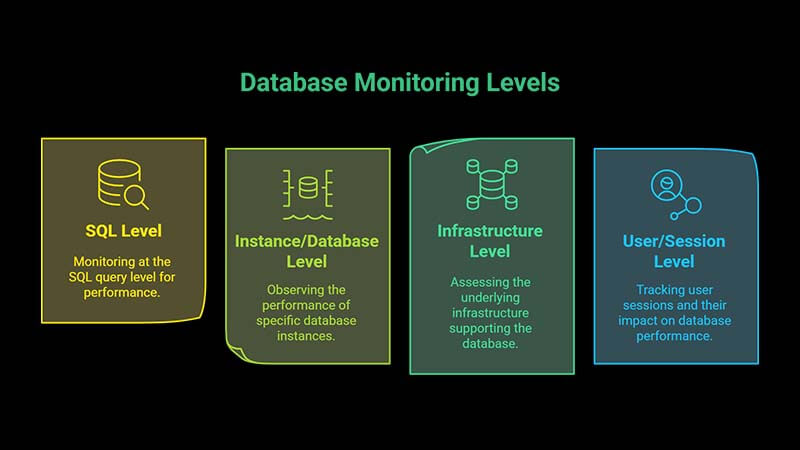
Below are four critical levels to focus on for maintaining optimal database performance.
1. SQL Level
Applications constantly send SQL queries to database instances, which process and return results. Poorly written queries can cause slow performance, high resource consumption, and concurrency issues. To optimize this level, focus on execution plans, query filtering, indexing, optimizer statistics, and implicit conversions.
2. Instance/Database Level
Every database platform, whether SQL Server, Oracle, MySQL, PostgreSQL, or NoSQL, affects performance differently. Monitoring at the instance level helps ensure databases operate efficiently by tracking I/O contention, locked objects, wait states, system parameters, and configuration files.
3. Infrastructure Level
The hardware and operating system running the database impact performance significantly. At this level, monitor CPU usage, memory allocation, storage subsystems, and network performance. Keeping infrastructure optimized ensures seamless database operations and minimal disruptions.
4. User/Session Level
User complaints often indicate database performance issues, but a lack of complaints doesn’t always mean everything is running smoothly. Monitoring user sessions helps detect slow queries, session locks, and unusual activity before they impact end users. Proactive database monitoring ensures potential problems are resolved early.
By tracking these four levels, businesses can achieve efficient database management, reduce downtime, and enhance system performance.
Key Metrics for Database Performance Monitoring
Tracking the right key metrics for database performance monitoring helps ensure speed, stability, and efficiency. These metrics provide insights into how well a database handles queries, resources, and connections. Ignoring them can lead to slowdowns, bottlenecks, or even crashes.
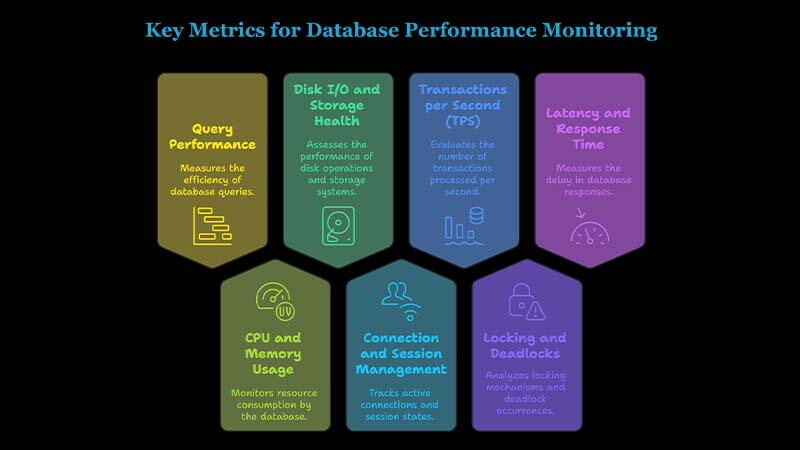
1. Query Performance
Fast queries are crucial for a smooth database. Monitoring query execution time, slow queries, and indexing efficiency helps optimize performance. Long-running queries should be optimized or rewritten for better efficiency.
2. CPU and Memory Usage
High CPU consumption and memory usage can slow down database operations. Monitoring these metrics ensures the system has enough resources to handle queries efficiently. Unexpected spikes may indicate performance issues.
3. Disk I/O and Storage Health
Databases rely on read/write speeds and disk usage for smooth operations. Tracking disk I/O, storage capacity, and fragmentation helps prevent slow responses. Optimizing indexes and partitioning large tables can improve performance.
4. Connection and Session Management
Too many active connections can overload the database. Monitoring active sessions, connection pooling, and timeout settings helps balance load and prevent crashes. Efficient session handling keeps the database stable.
5. Transactions per Second (TPS)
Tracking transactions per second (TPS) helps measure how well the database handles requests. A sudden drop may indicate a bottleneck, while a spike could mean increased demand. Balancing the load ensures smooth operations.
6. Locking and Deadlocks
Locking mechanisms prevent data conflicts, but excessive locking slows down performance. Monitoring deadlocks, row-level locking, and transaction conflicts helps ensure efficient processing without unnecessary delays.
7. Latency and Response Time
Slow response times lead to poor user experiences. Tracking database latency, query response time, and network delays ensures that applications remain fast and responsive. Reducing latency improves overall efficiency.
Monitoring these key metrics helps optimize queries, improve scalability, and prevent downtime. With the right tools and strategies, businesses can keep their databases running at peak performance.
Database Performance Monitoring Tools

Using the right database performance monitoring tools helps keep databases fast, efficient, and error-free. These tools track query performance, resource usage, and potential bottlenecks in real time. Without proper monitoring, slow queries and system overloads can disrupt operations.
1. Built-in Database Monitoring Tools
Most databases come with built-in tools for tracking performance. Database performance monitoring in SQL Server is possible using SQL Server Profiler and Performance Monitor. Similarly, MySQL users can rely on Performance Schema and Slow Query Log to identify issues.
2. Third-Party Database Monitoring Tools
Advanced database monitoring tools like New Relic, Datadog, and SolarWinds provide real-time insights and alerts. They help analyze query execution time, memory usage, and disk I/O across multiple database environments.
3. Open-Source Monitoring Solutions
For cost-effective monitoring, open-source tools like Prometheus, Zabbix, and Percona Monitoring offer robust features. These tools track database latency, active connections, and transaction performance, helping businesses optimize efficiency.
4. Cloud-Based Database Performance Monitoring Tools
Cloud databases require specialized monitoring solutions. AWS CloudWatch, Google Cloud SQL Insights, and Azure Monitor help track database load, response times, and resource utilization. These tools ensure databases stay optimized in cloud environments.
Using the right database performance monitoring tools prevents slowdowns and enhances scalability. Whether using built-in, third-party, or cloud-based solutions, continuous monitoring keeps databases running at peak performance.
Here’s a table for the Best Database Monitoring Tools:
| Tool | Best For | Trial Info | Price | Website |
|---|---|---|---|---|
| New Relic | Startups and small businesses | Free plan available | From $25/user/month (billed annually) | Visit Website |
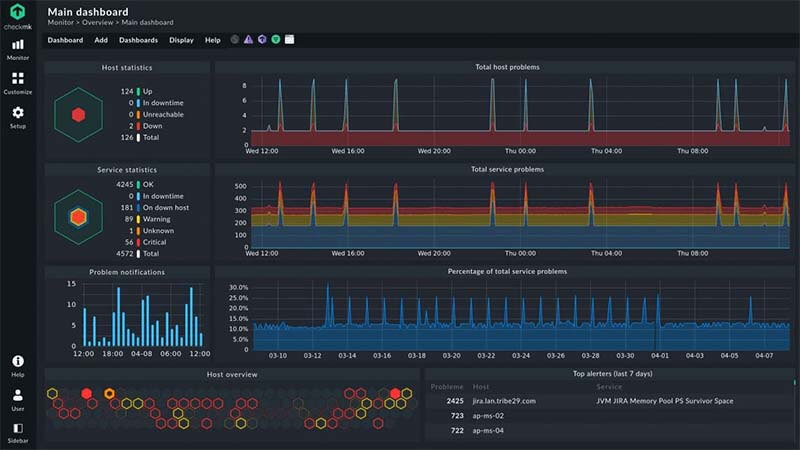
| Checkmk | Scalable IT monitoring platform | Free plan + 30-day free trial | From $225/month (billed annually) | Visit Website |
| ManageEngine Applications Manager | Database performance optimization | 30-day free trial | Pricing upon request | Visit Website |
| Netdata | Real-time system health monitoring | Free plan available | From $3.52/node/month | Visit Website |
| Datadog | Secure database monitoring | 14-day free trial | From $15/user/month (billed annually) | Visit Website |
| Quest Foglight for Databases | Cross-platform database monitoring | 30-day free trial | Pricing upon request | Visit Website |
| SolarWinds Database Performance Analyzer | Machine learning-powered performance tuning | 14-day free trial | From $1,275 (billed annually) | Visit Website |
| Paessler PRTG | Easy-to-use IT infrastructure monitoring | Free trial available | From $179/month (billed annually) | Visit Website |
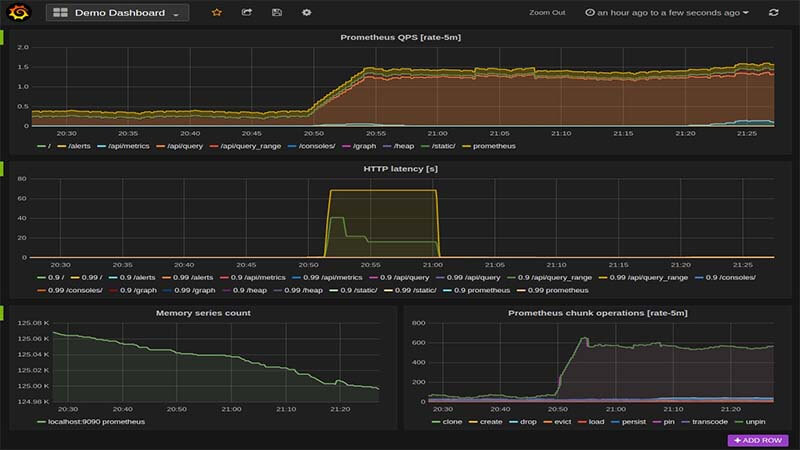
| Prometheus | Time series-based monitoring | Free consultation available | Pricing upon request | Visit Website |
Essential Tips to Optimize Database Performance Monitoring
Effective database performance monitoring ensures fast queries, stable operations, and minimal downtime. Following best practices helps prevent bottlenecks and improves efficiency. A well-optimized database enhances user experience and system reliability.
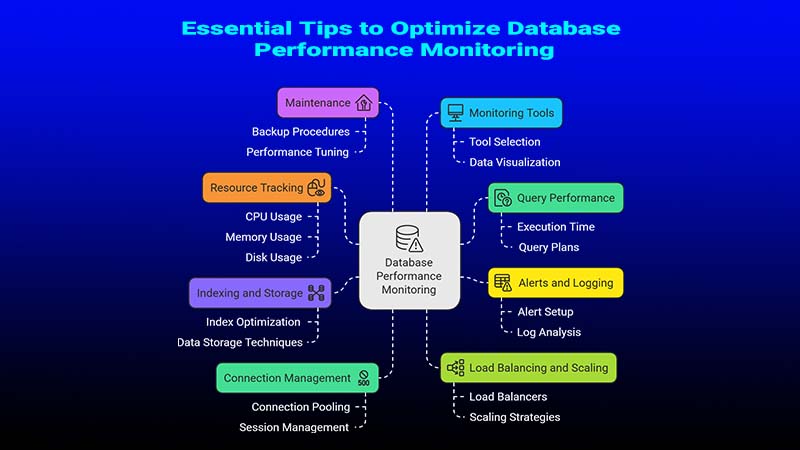
1. Monitor Query Performance Regularly
Slow queries are a major cause of database lag. Use query optimization techniques, proper indexing, and execution plan analysis to improve speed. Regularly review query execution time to identify inefficiencies.
2. Track CPU, Memory, and Disk Usage
High CPU consumption, excessive memory usage, and disk I/O bottlenecks slow down databases. Monitor these metrics to prevent performance issues. Optimizing resource allocation ensures smooth database operations.
3. Set Up Real-Time Alerts and Logging
Proactive monitoring helps prevent failures. Configure alerts for high query load, deadlocks, and long-running transactions. Logging query performance provides insights for troubleshooting.
4. Optimize Indexing and Data Storage
Proper indexing speeds up searches and reduces query load. Avoid excessive indexing, as it can slow down write operations. Use table partitioning, caching strategies, and storage optimization for better performance.
5. Manage Database Connections Efficiently
Too many open connections can overload the database. Use connection pooling, session management, and timeout settings to optimize database load. Limiting unnecessary connections improves stability.
6. Implement Load Balancing and Scaling Strategies
As data grows, databases need better resource distribution. Use horizontal scaling, read replicas, and load balancers to distribute queries efficiently. This prevents performance slowdowns during peak traffic.
7. Schedule Regular Database Maintenance
Frequent maintenance keeps databases healthy. Perform index rebuilding, query tuning, and data archiving to optimize performance. Cleaning up unused data improves database efficiency.
8. Use Advanced Database Monitoring Tools
Tools like SQL Server Profiler, Prometheus, and New Relic provide real-time insights. They track database latency, query performance, and resource usage, helping teams fix issues before they escalate.
Following these database performance monitoring best practices ensures fast queries, high availability, and optimized system performance. With proactive monitoring, businesses can keep databases running smoothly and efficiently.
Common Database Performance Issues and Solutions
Even a well-structured database can face performance problems. Slow queries, high resource usage, and connection issues can disrupt applications. Using database monitoring tools open-source can help detect and resolve these problems efficiently.
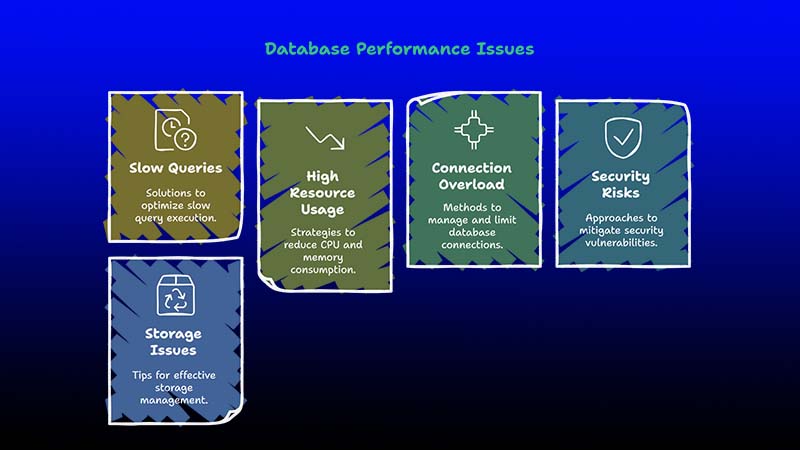
1. Slow Query Execution
Poorly optimized queries slow down database response time. Indexing, query optimization, and caching improve performance. Database Performance Analyzer open-source tools help analyze slow queries and suggest optimizations.
2. High CPU and Memory Usage
Excessive CPU consumption and memory leaks lead to lagging systems. Monitoring tools like Database Monitoring Datadog track resource usage in real-time. Adjusting resource limits and optimizing queries can resolve these issues.
3. Connection Overload
Too many simultaneous database connections can crash the system. Using connection pooling and load balancing helps distribute traffic efficiently. Database monitoring tools list includes solutions like Prometheus and Zabbix for tracking connection limits.
4. Security Vulnerabilities
Weak security settings expose databases to cyber threats. Database Monitoring Security tools detect unauthorized access and unusual activity. Encrypting sensitive data and enforcing strong authentication improve protection.
5. Poor Storage Management
Fragmented data and excessive logging increase disk usage. Regular index rebuilding, data archiving, and partitioning keep the database efficient. Open-source tools help monitor disk I/O and storage health.
Advanced Techniques for Database Performance Optimization
Optimizing database performance requires advanced strategies. Using database monitoring tools open-source, businesses can analyze and fine-tune performance. These techniques help maintain fast, stable, and scalable databases.
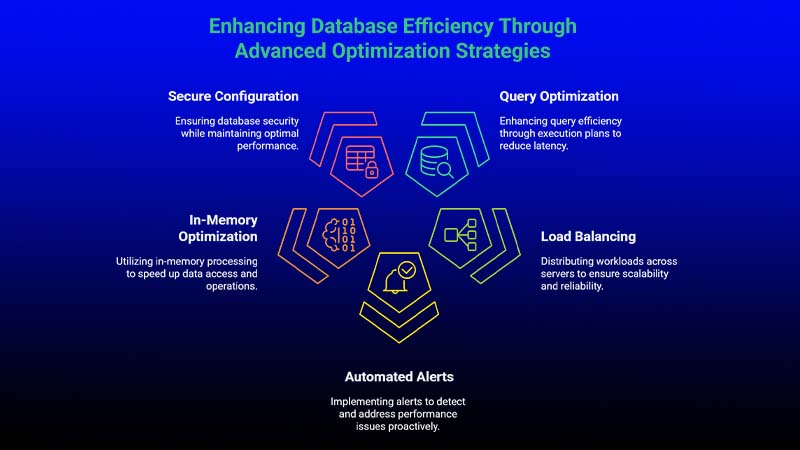
1. Query Optimization with Execution Plans
Analyzing query execution plans reveals inefficiencies. Rewriting complex queries, using proper indexing, and reducing nested loops improve speed. Database Performance Analyzer open-source tools provide deep query insights.
2. Load Balancing and Horizontal Scaling
Spreading database load across multiple servers prevents bottlenecks. Read replicas, database sharding, and caching strategies enhance performance. Monitoring tools ensure proper resource distribution.
3. Automated Performance Alerts
Real-time alerts notify teams about slow queries, high resource usage, or security risks. Database Monitoring Datadog offers automated alerts and reports for proactive issue resolution.
4. In-Memory Database Optimization
Using in-memory databases like Redis or Memcached speeds up query processing. Storing frequently accessed data in memory reduces disk I/O delays and improves performance.
5. Secure and Optimized Database Configuration
Configuring databases with best security and performance settings prevents downtime. Database Monitoring Security tools identify vulnerabilities. Regular audits ensure compliance with security standards.
Using these advanced database performance optimization techniques helps businesses maintain fast queries, strong security, and efficient database management. With the right monitoring tools, database performance can be continuously improved.
Upcoming Trends in Database Performance Monitoring and Optimization
Database performance monitoring is evolving rapidly. As data grows and systems become more complex, new technologies are shaping the future. Businesses need intelligent database monitoring tools to maintain speed, security, and efficiency.
1. AI and Machine Learning for Predictive Monitoring
AI-driven database performance monitoring is becoming more common. Machine learning algorithms analyze patterns and predict query slowdowns, resource spikes, and security threats. This helps prevent issues before they impact performance.
2. Automated Database Optimization
Manual tuning is time-consuming. Future database monitoring tools will include automated performance tuning, self-healing mechanisms, and real-time adjustments. These features improve efficiency without human intervention.
3. Cloud-Native Database Monitoring
As cloud databases grow, cloud-based monitoring solutions are becoming essential. Tools like AWS CloudWatch, Azure Monitor, and Google Cloud SQL Insights offer deeper insights into latency, scalability, and resource allocation.
4. Enhanced Database Monitoring Security
With rising cyber threats, database monitoring security is a top priority. Future tools will focus on real-time threat detection, access control monitoring, and automated security patching to prevent data breaches.
5. Unified Multi-Database Monitoring
Organizations use multiple databases across different platforms. Future database performance monitoring tools will offer unified dashboards to track SQL, NoSQL, and cloud databases in one place, making management easier.
6. Edge Computing and Distributed Database Monitoring
As edge computing and IoT gain popularity, databases will be more decentralized. Monitoring tools will need to track distributed data processing, real-time replication, and synchronization across different locations.
The future of database performance monitoring is focused on automation, security, and predictive analytics. Businesses that adopt these trends will ensure fast, scalable, and secure database systems for years to come.
Proactive vs. Reactive Database Monitoring
Effective database performance monitoring requires a smart approach. Monitoring can be proactive or reactive, each with its own benefits. A proactive monitoring strategy helps prevent issues before they happen, while reactive monitoring focuses on fixing problems after they occur.
Proactive Database Monitoring
Proactive monitoring continuously tracks database performance, resource usage, and potential security threats. It uses real-time performance alerts to detect slow queries, high CPU load, or unusual activity before they cause failures. This approach improves database stability and reduces downtime.
Reactive Database Monitoring
Reactive monitoring comes into play after a problem has already affected the system. It relies on error logs, system reports, and troubleshooting tools to identify and resolve issues. While it helps fix unexpected failures, relying only on reactive monitoring can lead to longer downtimes.
Combining both proactive and reactive database monitoring ensures better performance, security, and reliability. A proactive approach minimizes risks, while a reactive strategy helps recover from unexpected failures quickly.
Monitoring Performance Alerts
Database performance alerts play a crucial role in maintaining smooth operations. They notify administrators about slow query execution, high memory usage, security vulnerabilities, or system failures.
Setting up automated database monitoring alerts allows teams to respond immediately to potential problems. Advanced database performance monitoring tools can generate real-time alerts, helping businesses optimize database performance and prevent downtime.
A well-structured database alert system improves efficiency, security, and overall database health.
Frequently Asked Questions:
Q1. What are the key benefits of database performance monitoring?
Database performance monitoring improves query efficiency, system stability, and resource management. It helps detect slow queries, high CPU usage, and security threats before they impact performance. With real-time monitoring, businesses can prevent downtime and enhance database security and scalability.
Q2. How does database performance monitoring improve security?
Database monitoring tracks unauthorized access, unusual activity, and potential data breaches. It helps detect SQL injection attacks, excessive failed login attempts, and privilege misuse. Security-focused monitoring tools provide real-time alerts, allowing administrators to take quick action.
Q3. What role does automation play in database performance monitoring?
Automation simplifies database health checks, performance tuning, and issue detection. Automated alerts, AI-driven anomaly detection, and predictive analytics help businesses manage databases efficiently. This reduces manual effort and ensures continuous performance optimization.
Q4. How do cloud-based database monitoring tools differ from on-premise solutions?
Cloud-based monitoring tools offer scalability, real-time insights, and remote access. They integrate with cloud databases like AWS, Azure, and Google Cloud SQL. On-premise solutions provide more control over data security but require hardware maintenance and manual updates. Learn more.
Q5. How can businesses reduce downtime with database monitoring?
By using proactive database performance monitoring, businesses can identify performance bottlenecks, connection failures, and storage issues early. Setting up real-time alerts and automated recovery mechanisms ensures minimal downtime and smooth database operations.
Q6. What are the challenges of database performance monitoring?
Common challenges include handling large datasets, integrating multiple databases, and configuring effective alerts. Some monitoring tools generate too many false alerts, making it hard to prioritize issues. Choosing the right database monitoring tools helps overcome these challenges.
Q7. How often should database performance monitoring be conducted?
Continuous monitoring is ideal for critical applications to prevent system failures. However, scheduled performance audits should be conducted weekly or monthly to analyze trends and optimize database efficiency. Automated monitoring ensures round-the-clock tracking without manual intervention.
Wrapping Up:
Database performance monitoring is essential for maintaining speed, security, and reliability. It helps detect issues early, optimize queries, and prevent downtime. With the right monitoring tools and strategies, businesses can ensure smooth database operations. Investing in continuous monitoring leads to better performance and long-term efficiency.